The adoption of cloud technology has made it easy to set up and manage large numbers of server for business and applications needs. Organizations opt for high amounts of servers to satisfy load balancing needs and also to cater to situations like disaster recovery.
Given these trends, server monitoring tools have become extremely important. There are different types of server monitoring tools. They cater to various aspects of the monitoring of servers. In this article, we looked at 18 of best software tools to monitor servers.
Best Server Monitoring Tools
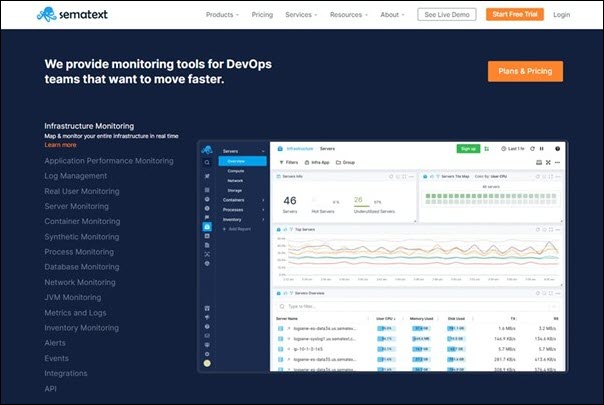
Sematext, a cloud-based monitoring tool, offers a comprehensive suite of tools for monitoring infrastructure and applications, log management, real-time monitoring and synthetic monitoring. Over 10,000 organizations depend on it, including some of the world’s largest companies.
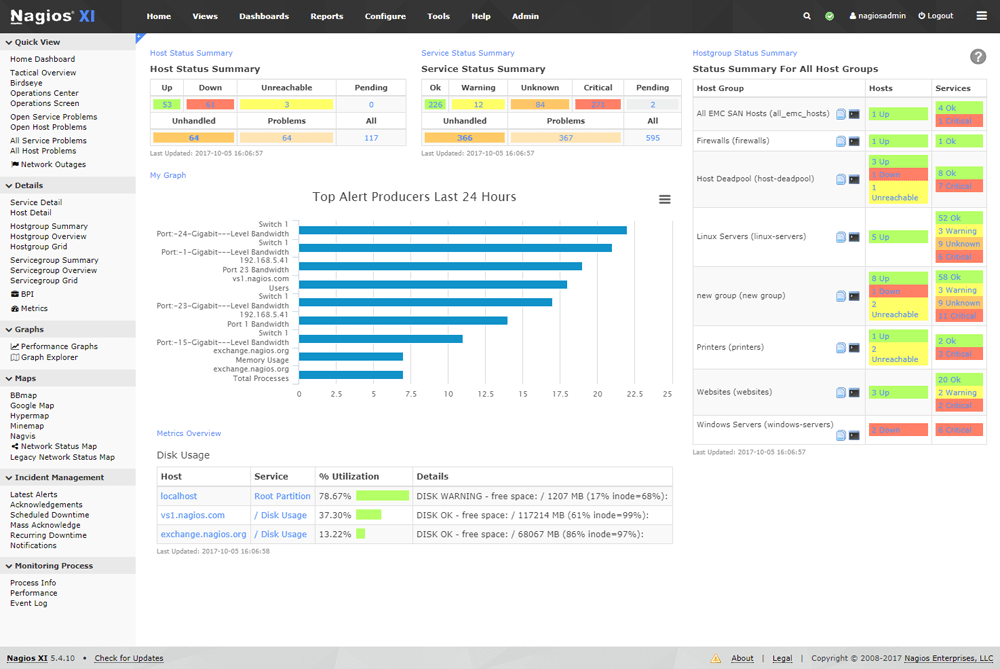
Sematext provides full-stack infrastructure monitoring solutions that provide visibility into both on-premise and cloud deployments. Users can see the health and performance of their infrastructure through information about applications, servers containers, processes databases, and more. Sematext can help identify the root causes of infrastructure problems, troubleshoot, debug and ensure peak performance for the entire stack with fully customizable monitors. The lightweight agent can be installed on bare metal, VMs and Docker. Users can map their entire infrastructure in real-time. Sematext does not come for free, but its pricing is reasonable. Try the 14-day trial version (no need for a credit card). A list of server monitoring tools would be incomplete without Nagios. This is a reliable tool for monitoring server health. Nagios XI can monitor any type of internal application with the help of third-party plug-ins. Nagios is equipped with a robust monitoring engine and an updated web interface to facilitate excellent monitoring capabilities through visualizations such as graphs.
Sematext Getting a central view of your server and network operations is the main benefit of Nagios. Nagios Core can be downloaded for free. Nagios Core is recommended for its advanced monitoring, reports, and configuration features.
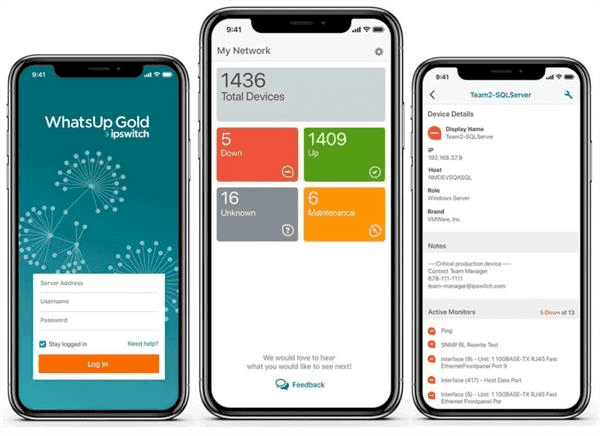
WhatsUp Gold, a popular monitoring tool for Windows Servers, is well-established. WhatsUp Gold’s robust layer 2/3 detection capabilities allow it to create interactive maps that show the network infrastructure in detail. It can monitor web servers, applications, virtual machines, and traffic flow across Windows, Java, and LAMP environments.
It provides real-time alerts via email and SMS in addition to the monitoring and management capabilities offered in the integrated mobile application. The integrated REST API’s features include capabilities such as integrating monitoring data with other applications and automating many tasks.
WhatsUp Gold provides specific monitoring solutions for AWS, Azure, and SQL Server environments. These solutions integrate with native interfaces, collecting data on availability, cost and other metrics specific to the environment.
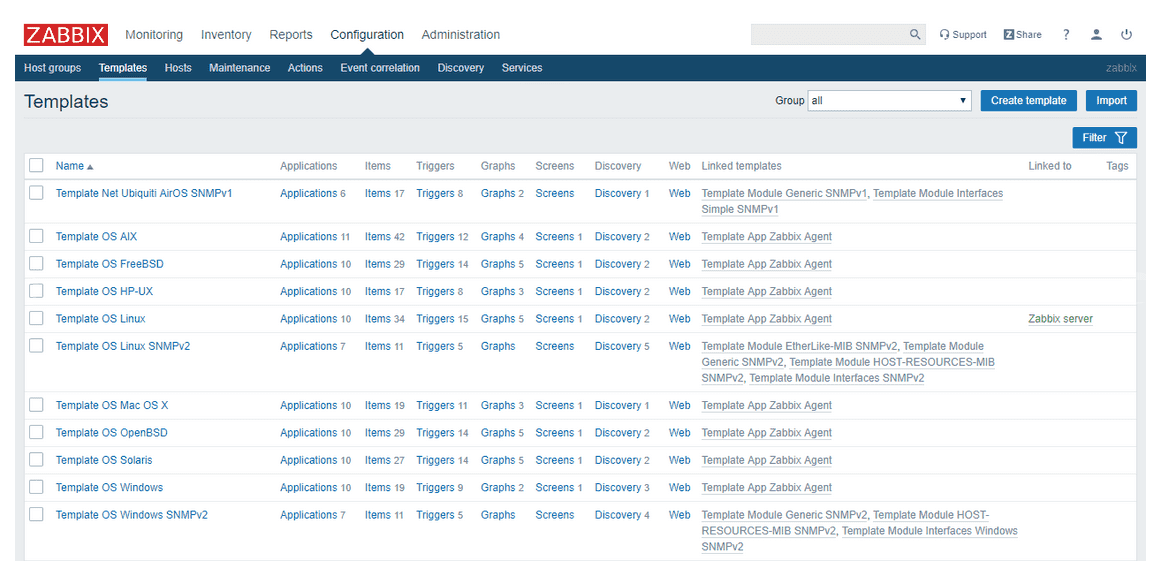
Zabbix, a Linux server monitoring software that is free and open source, can be downloaded for free. It is a high-end monitoring solution that allows monitoring of servers, networks and cloud services. One of its most significant advantages is the ability to configure directly from the web interface, rather than having to manage text files like on some other tools like Nagios.
Zabbix provides a multitude of metrics like CPU usage, free disk space, CPU temperature, fan state, and network status in its network management software. It also provides templates for popular operating systems like Linux, Ubuntu and Solaris, as well as servers such HP, IBM and Lenovo.
Nagios XI
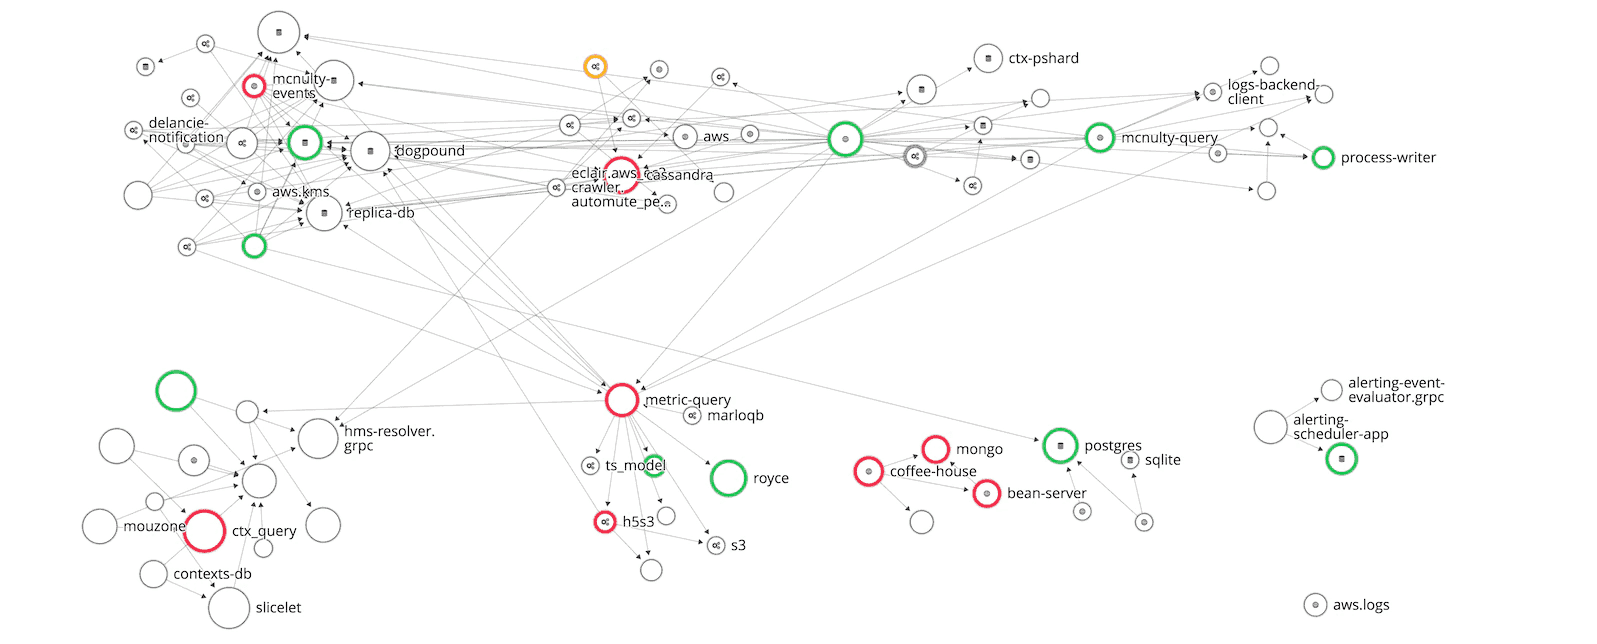
Datadog provides a single monitoring platform that can monitor your servers, stacks, and applications. Named a leader in intelligent application and server monitoring in 2019 by Forrester Wave, Datadog boasts of a centralized dashboard that brings many metrics together.
Datadog’s monitoring features include those required for servers and into the realm of source control and bug tracking as well. It facilitates many metrics such as traffic by container and source in cloud-native environment. Notifications are available by email, Slack, and many other channels.
Mapping dependencies and application architecture across teams has allowed users of Datadog to build a complete understanding of how applications and data flow work across large environments.
SolarWinds monitors server infrastructure, applications and databases. It also provides security monitoring. SolarWinds Server & Application Monitor’s vast (1,200+ pre-defined templates) for various types of servers & cloud services allows you to get started in minutes. These templates can quickly be customized to suit virtually any kind of setup.
WhatsUp Gold
SolarWinds application monitoring boasts a comprehensive system for virtual servers across on-premise, cloud, and hybrid environments to overcome VM Sprawl and having to switch to different tools. Tools are available for capacity planning, event monitoring, and data analysis with alerts and dashboards.
7.
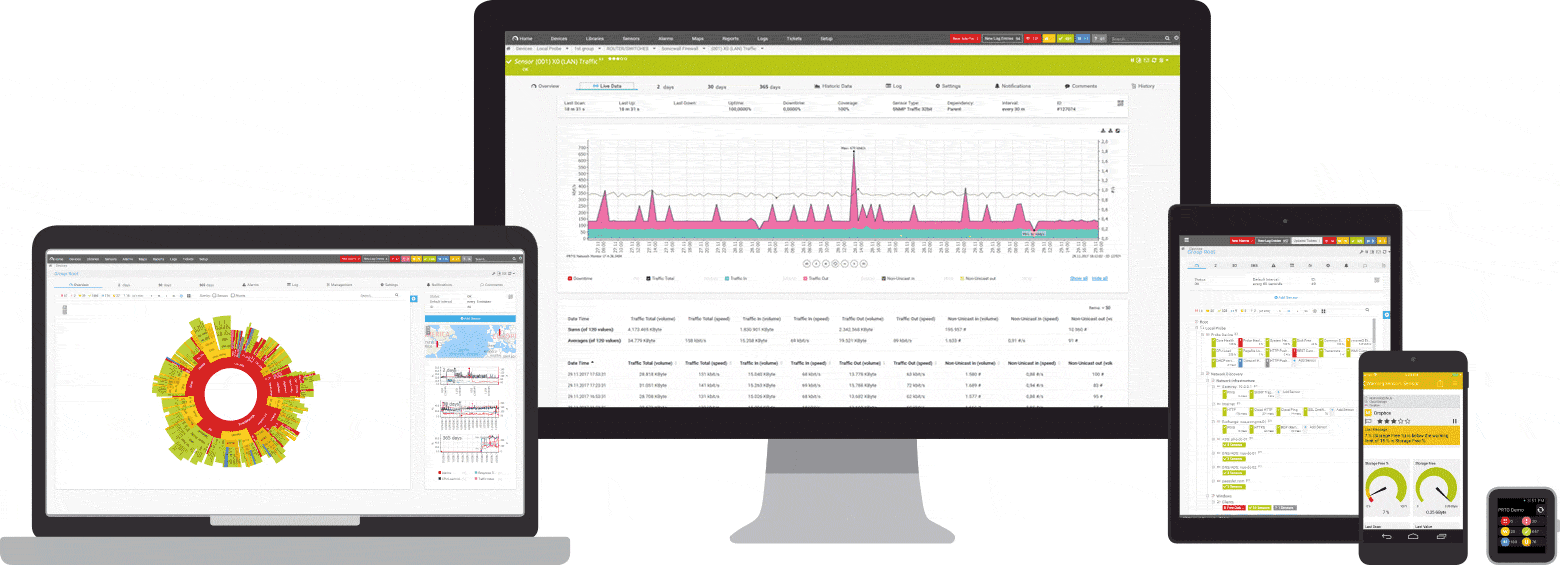
Paessler Router traffic Grapher, a server-management software, uses SNMP and Packet Sniffing. PRTG is compatible with both Windows and Linux servers. A wide range of server monitoring software applications is available for services, network, cloud, databases, and applications.
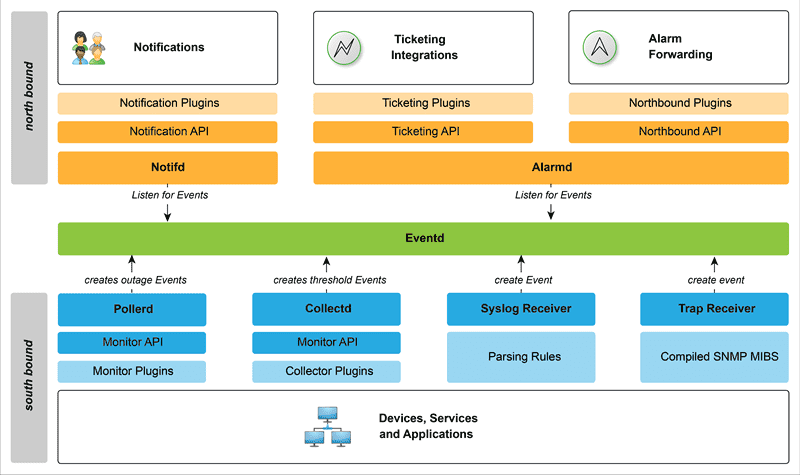
The PTRG server monitoring solution caters to web servers, database servers, mail, and virtual servers. PTRG’s cloud monitoring solution is its strongest suit, offering a centralized system to monitor all IAAS / SAAS / PAAS services such as Amazon Docker and Azure. It will continuously monitor your network security and provide automatic notifications and regular updates about firewall status. OpenNMS is an open-source server monitor solution that has been published under the AGPLv3 License. It has an extensible and flexible architecture that allows for the extension of service polling frameworks and performance data collection frameworks. OpenNMS is supported both by a large community and commercially by the OpenNMS group.
Zabbix
OpenNMS brings together the monitoring of many types of servers and environments by normalizing specific messages and disseminating them through a powerful REST API. Notifications can be sent via email, Slack or Jabber. They are also available through the Java Native Notification Strategy API. OpenNMS provides integrations for ticketing to RT JIRA OTRS and other systems.
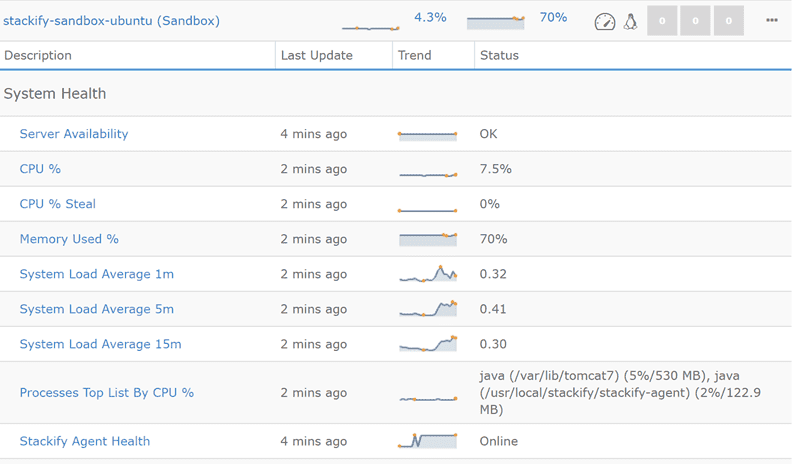
Retrace is a highly scalable monitoring tool that includes robust capabilities. This program is ideal for teams that are new and have little experience, as it has smart defaults that take into account your environment. This program gives you a headstart in monitoring servers and applications.
It monitors application performance, error tracking, log management, and application metrics. Retrace notifies relevant users via SMS, email, and Slack alerts based on multiple monitoring thresholds and notifications groups.
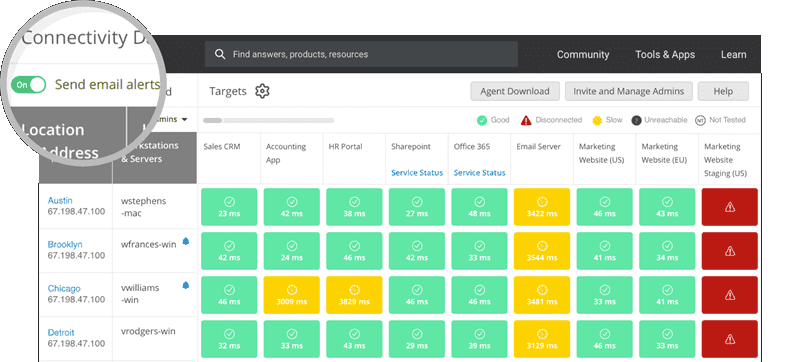
Custom dashboards allow Retrace to provide both holistic and granular data regarding server health. Dashboard widgets provide data on CPU utilization, disk space, uptime, and network utilization. Retrace works with both Windows and Linux servers. Spiceworks is a free server monitoring tool that simplifies server and network monitoring. The connectivity dashboard can be set up on any server in minutes, and after application URL configuration, monitoring can begin immediately.
Datadog
You will be able to receive real-time insights regarding slow network connections and overloaded applications, both on-premise as well as on the cloud. You can fix problems before they become a problem. Spiceworks has promised to provide a solution soon through email alerts for server and application events. Spiceworks promises to provide a solution for this problem soon, through email alerts of server and application events. vRealize hyperic is an open-source VMware tool that monitors server and network performance. It can be used to monitor a variety of operating systems. Including middleware and applications in both physical and virtual environments.
Infrastructure and OS application monitoring tools allow users to understand availability, utilization, events, and changes across every layer of your virtualization stack, from the vSphere hypervisor to guest OSs.
Middleware monitors collect data of thousands of metrics useful for application performance monitoring. The vRealize Operations Manager application provides centralized monitoring for infrastructure, middleware, and applications.
SolarWinds Server and Application Monitor
Icinga’s goals are simple: monitor availability, give users access to relevant data and send alerts. The integrated monitoring engine can monitor large environments including data centers. Users can create custom dashboards by grouping, filtering and combining elements. This setup allows you to take quick action to resolve any issues it’s identified.
Notifications arrive via email, SMS, and integrated web and mobile applications. Icinga is fully integrated with VMware environments and fetches data about hosts, virtual servers, databases, and many other metrics and displays them on a clean dashboard.
Instrumental monitors both your server and application. It is intuitive and clean. Instrumental integrates with Statiste and telegraf in addition to its native data collection methods. You can transform, aggregate and time-shift your data using the built-in querying language. Instrumental can send configurable alerts by email, SMS and HTTP notification when metrics change.
Paessler PRTG
Tornimo provides real-time monitoring and unlimited scaling. It is a Graphite-compatible application monitoring platform, with a Grafana-based dashboard. It also provides support for switching from a custom Graphite deployment or many other compatible SaaS platforms in minutes.
Tornimo uses a proprietary database system that allows it to handle up to a million metrics as your environment grows. Tornimo is trusted by clients to monitor mission critical systems regardless of the amount data they require to monitor. It lets users leverage older data in order to easily identify anomalies. It provides customizable dashboards to monitor your network at a glance. It provides customizable dashboards to monitor your network at a glance.
As a server monitoring solution for Windows, Linux, Solaris, and Unix, OpManager supports system health monitoring and process monitoring through SNMP and WMI for many platforms such as VMware, Hyper-V, and Citrix XenServer.
OpenNMS
The server management tools from Sciencelogic allow you to monitor all your server and network resources based on their configurations, performance, utilization, and capacity spanning across a multitude of vendors and server technologies.
Supported platforms include cloud services such as AWS, Azure, Google Cloud, and OpenStack. Sciencelogic supports Hypervisors such as VMware, HyperV, Xen and KVM, as well as Containers like Docker. In terms of operating systems, it supports Windows, Unix, and Linux.
Sciencelogic’s custom dashboards allow monitoring through ready-made or custom monitoring policies, using health checks and ticket queues associated with pre-defined events. It uses advanced API connectivity to merge with cloud services and provide accurate data for monitoring.
Retrace
Panopta provides server and network monitoring on-premises, in the cloud, or hybrid servers. Panopta provides a unified view across all your server environments through server agents and native cloud platform integrations.
A comprehensive library of out-of-the-box metrics makes setting up Panopta quick and convenient. These can be configured via customizable dashboards and reporting features for a clear holistic view. It avoids alert fatigue and false positives by filtering through accurate and actionable information.
CounterMeasures is a tool offered by Panopta to configure pre-defined remedial actions to resolve recurring issues as they are detected. Panopta’s SaaS monitoring platform provides organizations with a single monitoring point without the need for additional equipment, or to worry about what OS and licenses they use. Monitis, a simplified server, application, and other monitoring tool, is easy to sign up for and requires no software installation. A unified dashboard provides data on uptime and response time, server health, and many other custom metrics.
Instant alerts are supported via email, SMS, Twitter, and phone when any of the pre-defined triggers are activated. Monitis can send alerts when your network goes down. It also provides an API for additional monitoring needs so that users can import metrics and data to external applications.
Spiceworks Network Monitor
Monitis provides monitoring capabilities along with reporting that users can share. Users can access these features through both the web interface as well as the integrated mobile applications.
Choosing Server Monitoring Software
The top server monitoring tools we listed have one goal in common – to monitor the uptime and health of your servers and applications. Most of these tools offer free trials or free versions with limited functionality, so make sure to try them out before selecting the best server monitoring tool for your servers.
Looking for application performance monitoring tools, then read our guide on the 7 Best Website Speed and Performance Testing Tools.
vRealize Hyperic
If you would like to learn more, bookmark our blog and follow the latest developments on servers, container technology, and many other cloud-related topics.