Containers are now the standard in hosting applications. Cloud-based microservices have many benefits. This has allowed large and small organizations to deploy thousands of containers for their applications. Learn what you need about Docker container monitoring.
What is Container Monitoring?
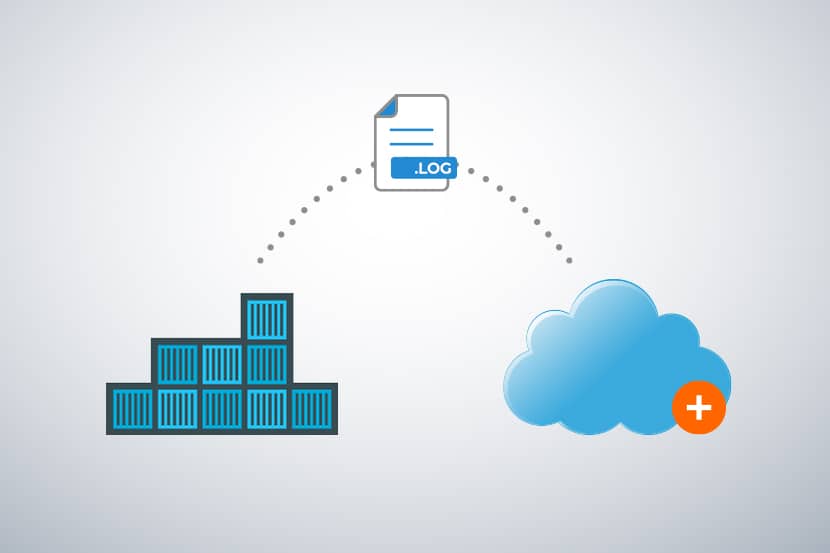
A company that deploys its applications using containers could have from a handful to thousands of them running at any one time. Containers with complex configurations may be dynamically removed and deployed depending on the expected scale and load. Monitoring the performance of containerized apps to ensure application continuity becomes essential when scaling. Monitoring and alerting becomes effective through analyzing metrics, obtained from many sources such as host and daemon logs, and monitoring agents installed on each node.
Why You Need to Monitor Docker Containers?
The health of an organization’s containerized applications directly impacts the efficacy of its business. Monitoring application performance is essential to ensure that containerized applications as well as the infrastructure are operating at optimal levels. Use these metrics to forecast resource needs more accurately, as it will lead to better resource allocations and deployments.
On-going monitoring keeps app performance at its peak. You can detect problems and fix them early, allowing you to be proactive. You can reduce risks in production. Monitor your entire environment to ensure you can make changes in a safe manner. Look at the analytics and see which tools are supported. Use a free trial to see if it’s right for you.
The Best Docker Container Monitor Tools
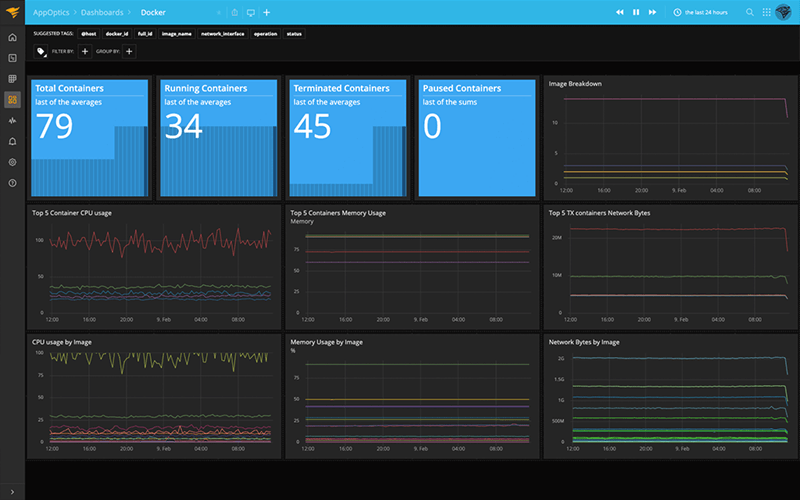
AppOptic’s pre-configured docker monitoring dashboard visualizes per-container CPU, Memory, and network metrics, among others. AppOptics’ integrations tab allows for quick integration of Docker and automatic connection with all hosts. Once the agent is active, data starts flowing through to the dashboard.
The dashboard visualizes each containerized application in a process-isolated manner. This feature allows you to identify any abnormal behavior. AppOptics provides monitoring for both on-premises and distributed clouds through a single dashboard.
SolarWinds offers a dashboard that tracks key metrics like CPU, memory and uptime for individual Docker containers. Instant alerts regarding depleted resources are a salient feature provided by SolarWinds.
One of the distinguishing features of SolarWinds is its ability to detect issues directly from the container layer, which gives it an edge over other traditional server monitors.
Shared resources are one of the major performance concerns for containers, especially when multiple containers are in use. One of SolarWind’s core strengths is the ability to isolate individual containers and monitor them concerning their neighboring nodes.
AppOptics Docker Monitoring with APM
SolarWinds focuses on average and peak loads to provide forecasts required for capacity planning on a separate dashboard of its own.
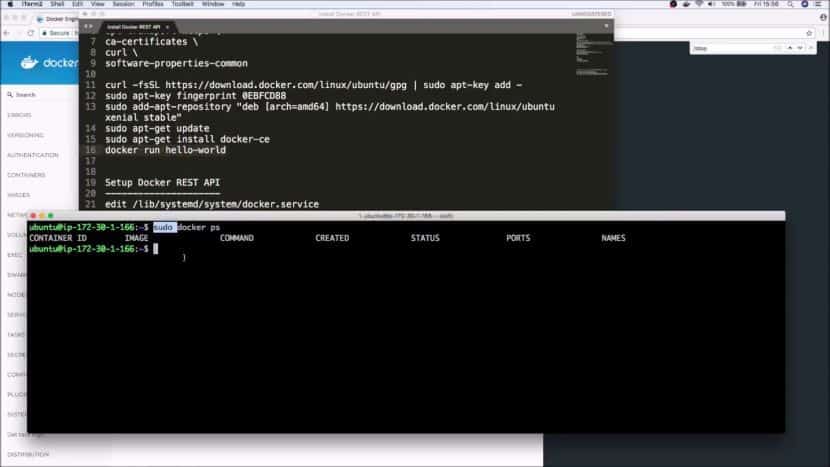
Prometheus, one of Docker’s three recommended solutions, is a well-known open-source Docker monitor tool. It can be installed as an image on Docker containers. It is not easy to configure for larger setups. It’s difficult to configure in larger setups. Docker targets do not allow monitoring of containerized applications. Docker recommends other tools for this purpose.
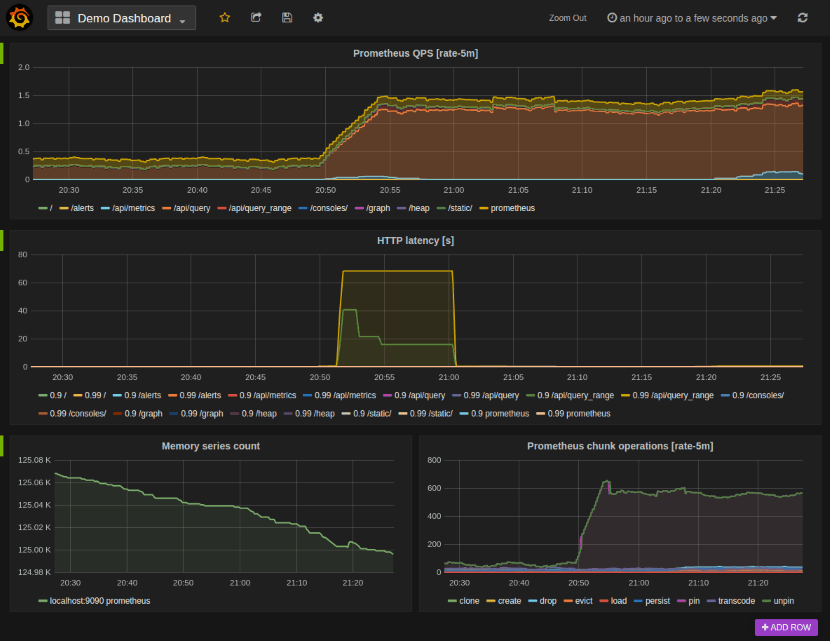
Prometheus provides a simple docker dashboard that visualizes the workloads of targeted Docker instances. It creates a volume for storing recorded metrics.
The Prometheus Query Language can be used to query metrics through the dashboard, either in graphical or tabular form. The integrated HTTP API makes this data available to external systems for seamless monitoring.
SolarWinds Server & Application Monitor
Docker is an official HTTP Web Service API that integrates with Docker. The Docker API can be used to connect to any external Docker Monitoring tool via secure API endpoints in order to collect metrics and store them or visualize them. It is most suitable for organizations who have their own monitoring applications that monitor containers from multiple service provider. The ManageEngine Applications Manager, a popular server-monitoring solution, has native support for Docker hosts. Monitoring is essential for containers as isolation happens at the kernel level with dynamic resource allocation. Monitoring becomes vital for containers as isolation happens at the kernel level with dynamic resource allocation.
In addition to the usual statistics like CPU, network, and memory, ManageEngine allows monitoring all containers within each host to reduce bottlenecks in performance and availability.
Application Manager allows to set up pre-configured rules regarding container status and performance metrics. It then uses these triggers to alert users via email or SMS whenever anomalies are detected, allowing them to resolve issues quickly before they escalate and affect performance.
Prometheus
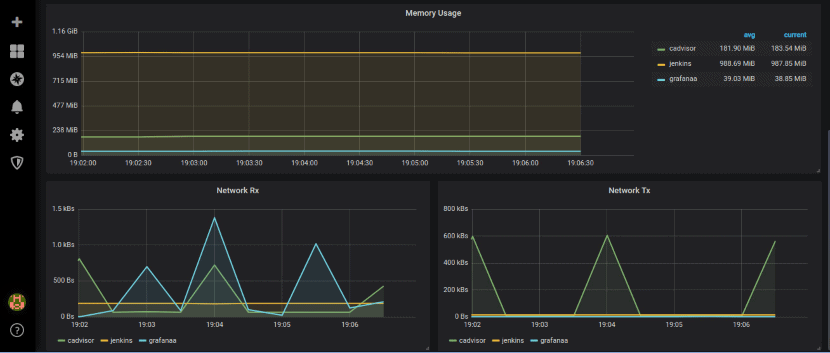
Google Container Advisor (cAdvisor), another open-source Docker Container Monitoring tool, is called Container Advisor. It is a running daemon that collects, aggregates, and exports resource usage and performance data of targeted containers.
cAdvisor is a popular tool known for its focus on resource isolation parameters, historical resource usage, and histograms of historical-data. This data is stored both by container as well as holistically for easier analysis of past performance and forecasting.
Builds of cAdvisor are available as images that you can install on Docker hosts. cAdvisor offers both a Web UI as well as a RESTful API for users who want to monitor Docker containers and integrate metrics into an external application using web service endpoints.
Librato offers all the features of SolarWinds, but with more customization. It provides the ability to monitor a wide range of languages and frameworks through RPC calls, queues, and other sources.
Librato provides native integrations to over 150 cloud solutions, including Docker making it very suitable for organizations that use multiple services. Librato takes an API-first approach to achieve this, making all metrics and statistics accessible via a secure web API.
Docker API
Dynatrace offers a solution that is ready-to-use for monitoring containerized apps without the need to modify run commands or install images. It automatically detects the creation of new containers and containerized applications.
Common Micro-deployments with highly dynamic Docker environments is one of Dynatrace’s strong suits. Monitoring tracks large numbers of Docker containers, which are deployed and removed dynamically.
Dynatrace enables extensive tracking and monitoring through log monitoring even when details such as docker name, ID, or host details are not available. Each detailed log entry includes all this information.
ManageEngine Applications Manager
This setup allows users to view virtual docker log monitoring of files that are specific to a particular container or application. Dynatrace is a great tool for monitoring, but it does not take up a lot of space.
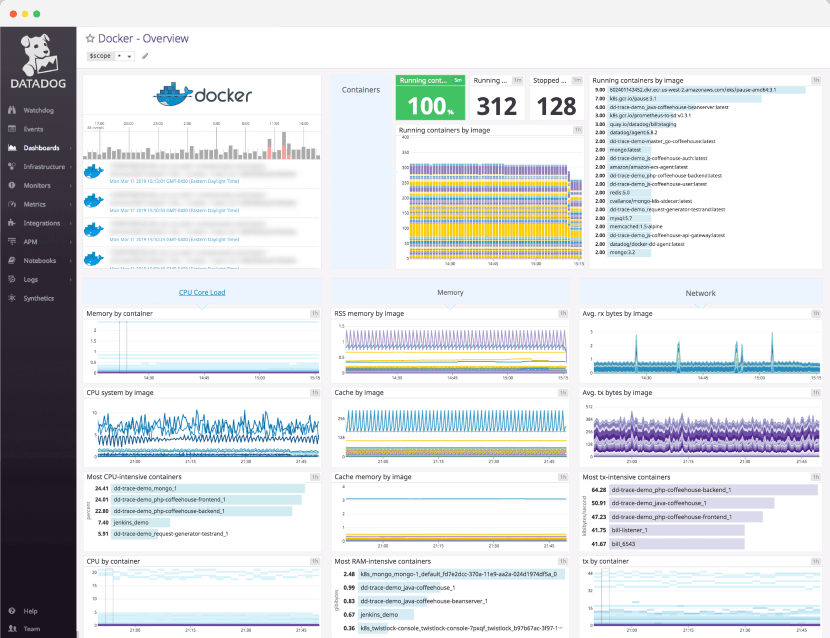
Datadog, another docker system monitor recommended by Docker. It provides integrations across hundreds of cloud services platforms, which makes it another good fit for organizations that have a mix of containerized applications and cloud solutions.
Monitoring is available across applications through Trace requests, which feed graphical visualizations and alerts. Datadog collects detailed log data to gather data about services, platforms, and applications. This data is automatically correlated and visualized to highlight unusual behavior.
Another feature of Datadog that distinguishes it is the ability to monitor data by the platform natively. This feature allows monitoring at both a holistic level and also down to the container level. This data is accessible via interactive dashboards which provide real-time information.
cAdvisor
10. Sysdig is the only Docker-specific monitoring solution that integrates directly with container metadata. Docker recommends Sysdig as a monitoring solution for containerized applications.
One of the most significant advantages of Sysdig is that it provides monitoring for containers, cloud services, and Kubernetes. The open-source Prometheus monitoring tool is part of the Sysdig platform and comes as an enterprise solution with a myriad of additional features.
Topology maps are a top feature provided by Sysdig to monitor traffic flows, identify bottlenecks, and understand dependencies between micro-services. Sysdig provides multi-conditional alerts for changes in metrics, nodes, and clusters. This data can be provided to incident management tools such as ServiceNow and Slack.
SolarWinds Librato
Sumo Logic provides a comprehensive monitoring experience through a container aware approach in contrast to other tools that use log-based monitoring.
It applies to host and daemon logs to provide a comprehensive overview of targeted Docker environments. The monitoring of the Docker infrastructure is done via a native source. Out-of-the box, you can get the usual bells and whistles such as alerts. Sumo Logic collects data centrally from each host using a container via the Docker Remote API, Inspect API and daemon logs. Sematext Agent Docker is an agent that collects data on all hosts and containers. It runs as a container. While it is a very light agent, it has to run on each of the Docker hosts that need monitoring.
Logagent is used to track and store logs of all container activity. These logs enable monitoring Docker containers with dashboards and alerts and track many metrics such as CPU, memory, network, I/O, and memory failed counters.
Dynatrace
Logs are structured and well suited for visualizing via the provided dashboard. You get further options like searching and filtering to facilitate troubleshooting.
Sematext can be deployed to all nodes within a swarm with a single command. It also supports the auto-discovery of applications running within containers for effortless monitoring.
Choosing the Best Docker Container Monitoring Tool
Docker is one of the many ways of deploying containerized applications. You can learn more about other container orchestration tools like Docker in our article about The Best Docker Orchestration Tools for 2020.
The difficulties of Docker monitoring revolve around containerized applications, isolated within containers, and with resources allocated dynamically.
Datadog
As container images become increasingly complicated with patches and updates, it is crucial to choose Docker monitoring tools that are robust and allow them to be deployed quickly across many thousands of nodes. Call us for more information on which tool will work best for you.